In Oracle SOA Suite 12c it is now possible to create subprocesses, which are a kind of reusable BPEL procedures or BPEL methods. The nice thing about it is that it is executed in the same thread.
IBM and SAP have created a BPEL extension (BPEL-SPE) to do the same job but Oracle implemented its own version.
You should know that subprocesses are not part of the BPEL 2.0 standard and added as an extension!
There are to variants of subprocesses:
- Standalone: Which are created and reused in the composite itself.
- Inline: Which are created and reused inside a particular BPEL process.
As a developer I was expecting that a subprocess have a well defined interface to hide the internals. But this isn't the case. A subprocess is just a call to a bunch of BPEL code. The only way to get something In or Out is by declaring variables inside the subprocess and create a mapping to these.
So what you should remember is that a subprocess doesn't have a service interface or endpoint.
When you create a inline subprocess it isn't possible to transform it into a standalone subprocess or visa versa. So in your design phase you should make the right decision.
You should know that a standalone subprocesses can only be called from BPEL processes and not from a mediator. Later in this blog I will explain how.
To be flexible I advise only to create standalone subprocesses because they can be reused by other BPEL processes (inside the composite) and can be reused more than ones in a particular BPEL process as well.
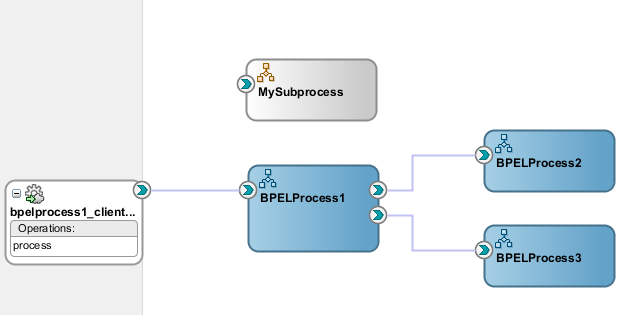
In the picture below you can find an example of the usage of a standalone BPEL subprocess from the composite perspective.

In this example does MySubprocess only adding the prefix string 'Hello ' to a input string.
In this example my BPEL's do nothing more except some variable mapping and invokes.
When calling the endpoint of the service with the string 'Gertjan', it will return 'Hello Hello Gertjan' as result of it. The second 'Hello ' is added because BPELProcess2 uses MySubprocess and the first 'Hello ' is added by BPELProcess3 (which reuses MySubprocess).
I the next part of this blog post I will go into the implementation (this is not a step-by-step tutorial).
The example (JDeveloper project) is available in github: Example Sources
The following steps are performed:
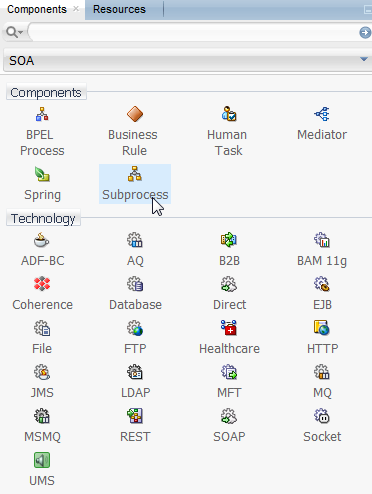
- Create Standalone Subprocess in Composite Editor
- Implement subprocess input and output variables
- Implement subprocess logic
- Create other logic
- Create subprocess call
- Test
1. Create Standalone Subprocess in Composite Editor
This will show the 'Create Subprocess' pop-up:

A subprocess is saved in the BPEL directory.
The Components swim-lane will now look like this:

2. Implement subprocess input and output variables
As stated earlier, the input and output is performed with variables. So you should create at least one input variable which can also be used as output variable. Alternatively you can create a separate output variable.Double click the just created subprocess and create an input/output variable. In this example I did the following:

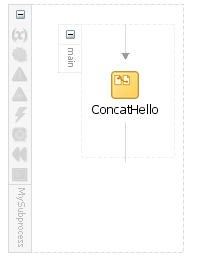
3. Implement subprocess logic
MySubprocess just contains one assign having the concat action:concat('Hello ', $InputOutputVariable)
I looks like this:
4. Create other logic
Now it's time to create your other logic.Create at lease one BPEL process because only a BPEL process can call a subprocess.
The in this blog post given creation sequence is not a mandatory sequence. In normal live I think the primary logic is created first and during development you decided to separate some BPEL logic in a subprocess because it's used more then once.
In the example here, I created three BPEL processes as show earlier. Up to this point the composite swim-lane should look like this.
5. Create subprocess call
Lets go into BPELProcess2 to see how the call to the subprocess looks like.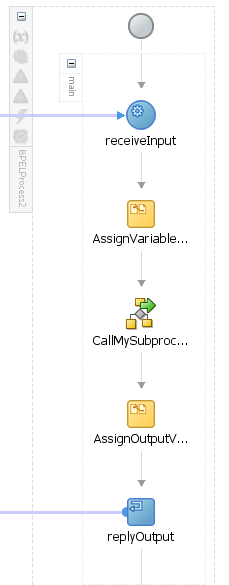
This isn't an invoke! Its an new added feature which is not part of the BPEL 2.0 standard and added by Oracle. For this the extensionActivity construct (see: extensionActivity for details) is used and the BPEL source code looks as following:

The definition of CallMySubprocess, reflecting this, is shown below:

There you can find the mapping of the InputOutputVariable to variableForCall. The checkbox 'Copy By Value' is deselected indicating that it's a copy-by-reference.
- Copy By Value selected: The literal value of the variable is copied. This is a one-way action.
- Copy By Value deselected: The reference to the variable is copied. This is a two-way action. When changing the subprocess variable, the other variable is changed accordingly.
So the data between MySubprocess and BPELProcess2 are interchanged by referencing InputOutputVariable (which is part of MySubprocess) to VariableForCall (which is part of BPELProcess2).
6. Test
When testing this example you will see the following in EM:
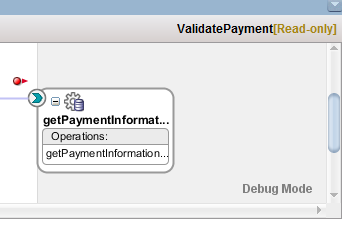
Drill-down into BPELProcess2 will show this (with the CallMySubprocess call!):

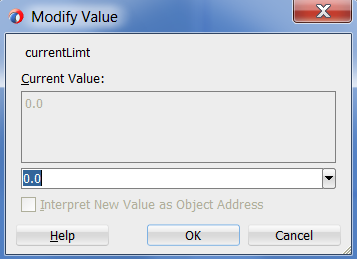
The reply is: 'Hello Hello Gertjan' when the input was 'Gertjan' as shown here:
%2B-%2BOracle%2BEnterprise%2BMan.png)
Some remarks you should know
In the SOA Suite 12c Developers Guide the following remarks are made regarding subprocesses:- There is no restriction on one BPEL subprocess calling itself recursively. You must determine if you want to recursively call the same BPEL subprocess and the number of times the subprocess calls occur.
- You can create and successfully deploy a SOA composite application that contains only a standalone subprocess. For example, create a SOA composite application and add a standalone subprocess in which you define two parameters for the subprocess and define an assign activity in the subprocess to swap the values of both parameters. However, while a SOA composite application that contains only a standalone subprocess and no other components can be deployed, it has no practical purpose.
- A standalone subprocess cannot be shared in the MDS Repository. However, a BPEL process with call activities for calling the subprocess can be shared in the MDS Repository.
- A standalone subprocess can include an inline subprocess.
- Creating an inline subprocess within an existing inline subprocess is not supported.