Oracle SOA Suite 12c Debugger Demystified
A new cool feature of the latest version of Oracle SOA Suite 12c is debugging. Finally we can debug our code at composite and even inside BPEL and OSB levels. Debugging of other service engines is not possible yet. This blog is going through some interesting aspects of debugging and the new world that we are entering.The debugger can only be performed when the SOA server is in Development mode and debugging is a single user and single server activity. So it isn't possible to share a development environment and do debugging with more than one developer at the same time. You even can't create new instances from the enterprise manager.
You should know that the focus of the debugger is the composite itself. So it's not possible to debug more composites at the same time.
I tried to combine the debugger with the Unit Test Framework and also this is not possible. This is because JDeveloper goes to a special mode (the swim lanes of exposed services and external references are become light yellow) and doing other things, like debugging, is not possible anymore.
I tested this by going to debug mode and after that I ran the test suite. But, when going to test mode a check is performed if the deployed version is equal the working version, which isn't in this case. So the test framework deploys a new version of the composite and debug mode is left.
It would be a cool feature when testing can be combined which debugging or at least you can reuse you input test cases for debugging features. Let's ask product development to at this feature in next patch release. For now we will focus on debugging.
Debugging is implemented by Oracle by using Java Platform Debugging Architecture (JPDA). This standard is structured as following:

JPDA is a multi-tiered debugging architecture that allows tools developers to easily create debugger applications which run portably across platforms, virtual machines (VM) implementations and JDK versions.
JPDA consists of three layers:
- Java VM Tool Interface (JVM TI): Defines the services a VM must provide for debugging. Includes requests for information (for example, current stack frame), actions (for example, set a breakpoint), and notification (for example, when a breakpoint has been hit). A debugger may make use of VM information other than this (for example, Java Native Interface (JNI)), but this is the source of all debugger specific information. Specifying the VM Interface allows any VM implementor to plug easily into the debugging architecture.
- Java Debug Wire Protocol (JDWP): Defines the communication between debuggee en debugger processes. It does not define the transport mechanism (socket, serial line, shared memory, ...). The specification of the protocol allows the debuggee and debugger front-end to run under separate VM implementations and/or on separate platforms. It also allows the front-end to be written in a language other than Java, or the debuggee to be non-native (e.g. Java).
- Java Debug Interface (JDI): Defines a high-level Java language interface which tool developers can easily use to write remote debugger applications. It defines information and requests at a user code level.
Breakpoint events are generated whenever a thread reaches a location
designated as a breakpoint
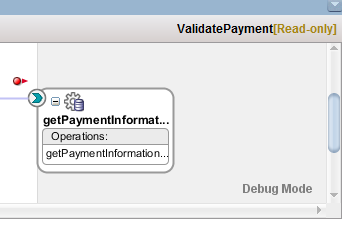
The JVM TI talks by using JDWP to the engine.When you start debugging a particular composite a redeployed and the server is started in debug mode. In JDeveloper the composite is set to Read-Only and Debug Mode label is shown as following:
I looked at the deployed code, by searching into the jar, for any hooks but I wasn't able to find any of these. So basically debugging is performed transparent. That is exactly what JPDA promises.
What you should know is that the debugger talks against a special debug port. This can be set in JDeveloper as following: Set Host, Port and Timeout at "Project Properties > Run/Debug > Edit > Tool Settings > Debugger > Remote".
For synchronous services the setting of the Timeout property is sometimes not enough. In this case you will get and HTTP 500 internal server error in the HTTP Analyzer and you will get the following error response:
<?xml version = '1.0' encoding = 'UTF-8'?>To solve this you should set the following properties accordingly:
<env:Envelope xmlns:env="http://schemas.xmlsoap.org/soap/envelope/">
<env:Header>
<tracking:faultId xmlns:tracking="http://oracle.soa.tracking.core.TrackingProperty">1</tracking:faultId>
</env:Header>
<env:Body>
<env:Fault>
<faultcode>env:Server</faultcode>
<faultstring>Transaction timed out after 301 seconds
BEA1-33F38DED3BB59E472B1E</faultstring>
<faultactor/>
<detail>
<exception/>
</detail>
</env:Fault>
</env:Body>
</env:Envelope>
-
Increase the SyncMaxWaitTime property in Oracle Enterprise Manager Fusion Middleware Control.
-
Increase the Idle Timeout and Transaction Timeout values for the Enterprise JavaBeans property BPELDeliveryBean in Oracle WebLogic Server Administration Console.
-
Increase the Java Transaction API (JTA) timeout value located under the JTA link on the Oracle WebLogic Server Administration Console home page.
-
The SOA composite application name and the Oracle JDeveloper project name must be the same.
Any SOA composite application encountered during a debugging session must reside in the currently active workspace in Oracle JDeveloper.
Debugging is limited to design view in Oracle JDeveloper. You cannot run the SOA debugger in Oracle Enterprise Manager Fusion Middleware Control.
Debugging is a localized user experience. If you want to switch to other tasks (for example, search for instances or initiate new instances of the same composite from Oracle Enterprise Manager Fusion Middleware Control), close the debugging session.
You cannot set breakpoints on REST services.
The breakpoints that you create for debugging in a SOA composite application in one installation of Oracle JDeveloper are not available to other Oracle JDeveloper installations. You must create the breakpoints again for debugging.
During a debugging session in which you are using the embedded Integrated WebLogic Server, you cannot use the version of Oracle Enterprise Manager Fusion Middleware Control included with the embedded server to generate new instances or query instances.
You cannot debug cross-language features, such as a Java
execactivity, XSLT and XQuery transformations, and so on.You can debug SOA composite applications on servers on which Oracle SOA Suite is installed. For example, if Oracle SOA Suite runs on managed servers, clients must connect using the managed server host and port.
Only one client at a time can connect to the SOA debugger.
You cannot debug multiple instances of the same SOA composite application at a given time even though Oracle JDeveloper does not restrict you from this action. This is not the correct approach. The SOA debugger is a development tool. It is your responsibility to ensure that only a single instance is debugged at any given time.
Adapter endpoint errors are not displayed in the SOA debugger in Oracle JDeveloper. Those errors are logged in the log file.
You can only debug if the server is in development mode. Debugging in production mode is not supported.
Oracle B2B and Oracle SOA for Healthcare service and reference binding components cannot be debugged with the SOA debugger even though you can set debugging points on both components.
SOA composite application-to-SOA composite application debugging is not supported.
Good luck with debugging.
ReplyDeleteIt 's an amazing article and useful for developers
Oracle SOA Online Training